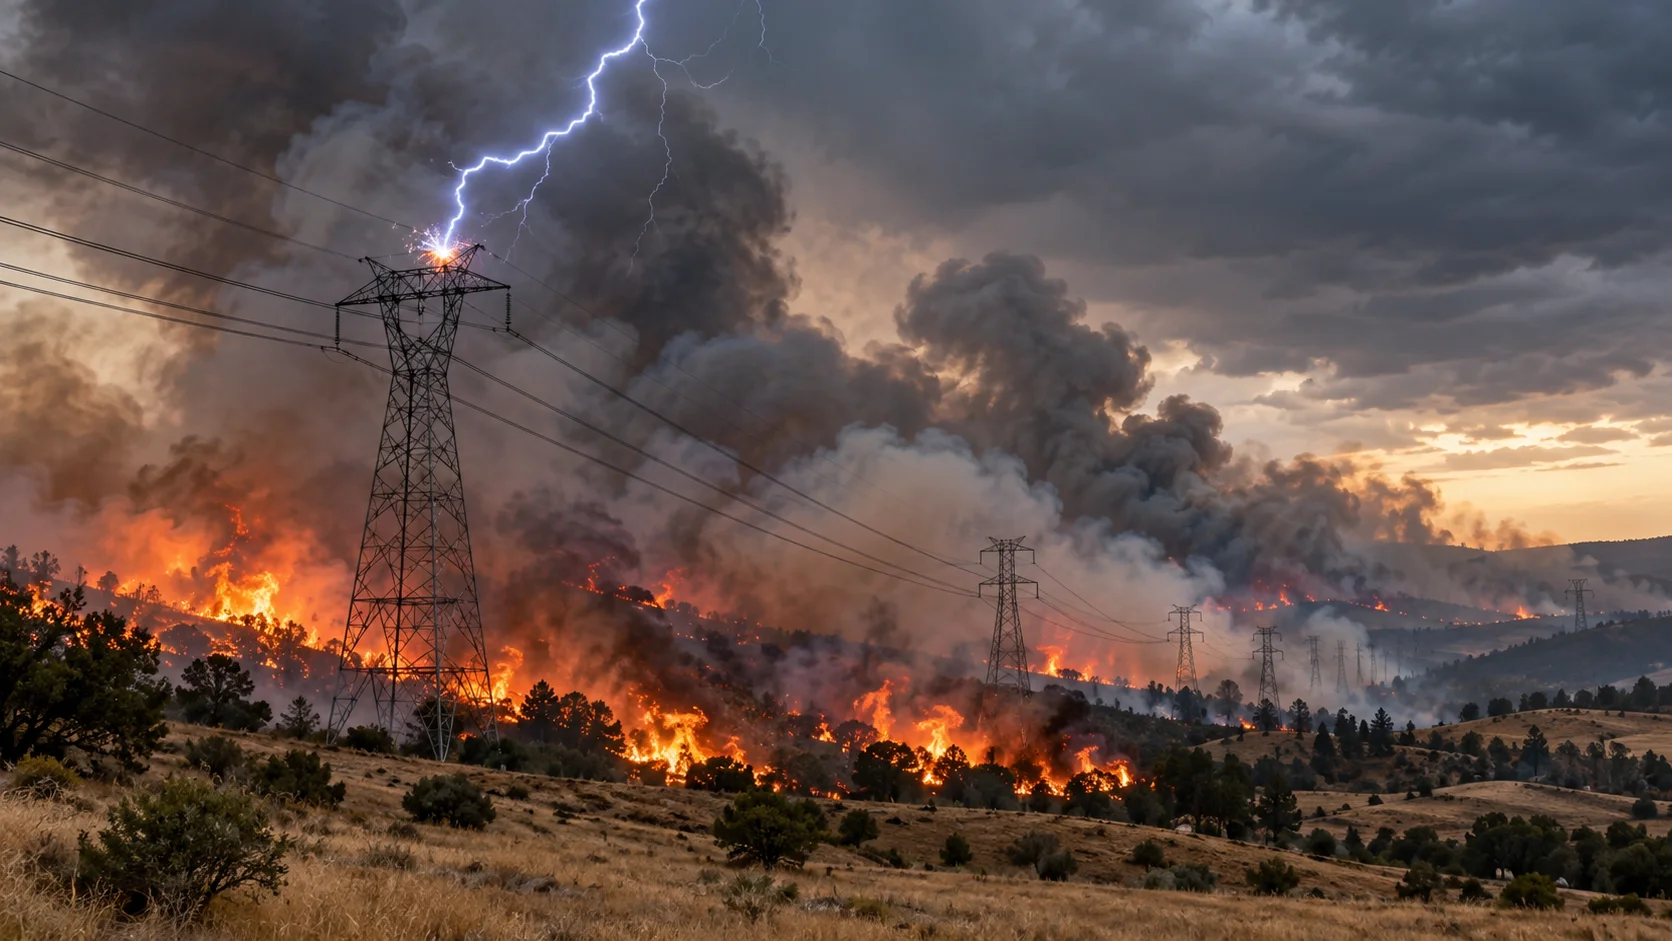
Preparing for extreme wildfire risk.
Wildfire season is getting longer and costlier. Signal4D gives utilities, landowners and agencies one proactive view — from the conditions that start fires to the exact assets in their path.
Wildfire is a weather-driven risk.
Ignition and spread are driven by a handful of conditions. Watch them together — across your territory and ahead in time — and you can act before a spark becomes a catastrophe.
What Signal4D detects & alerts on
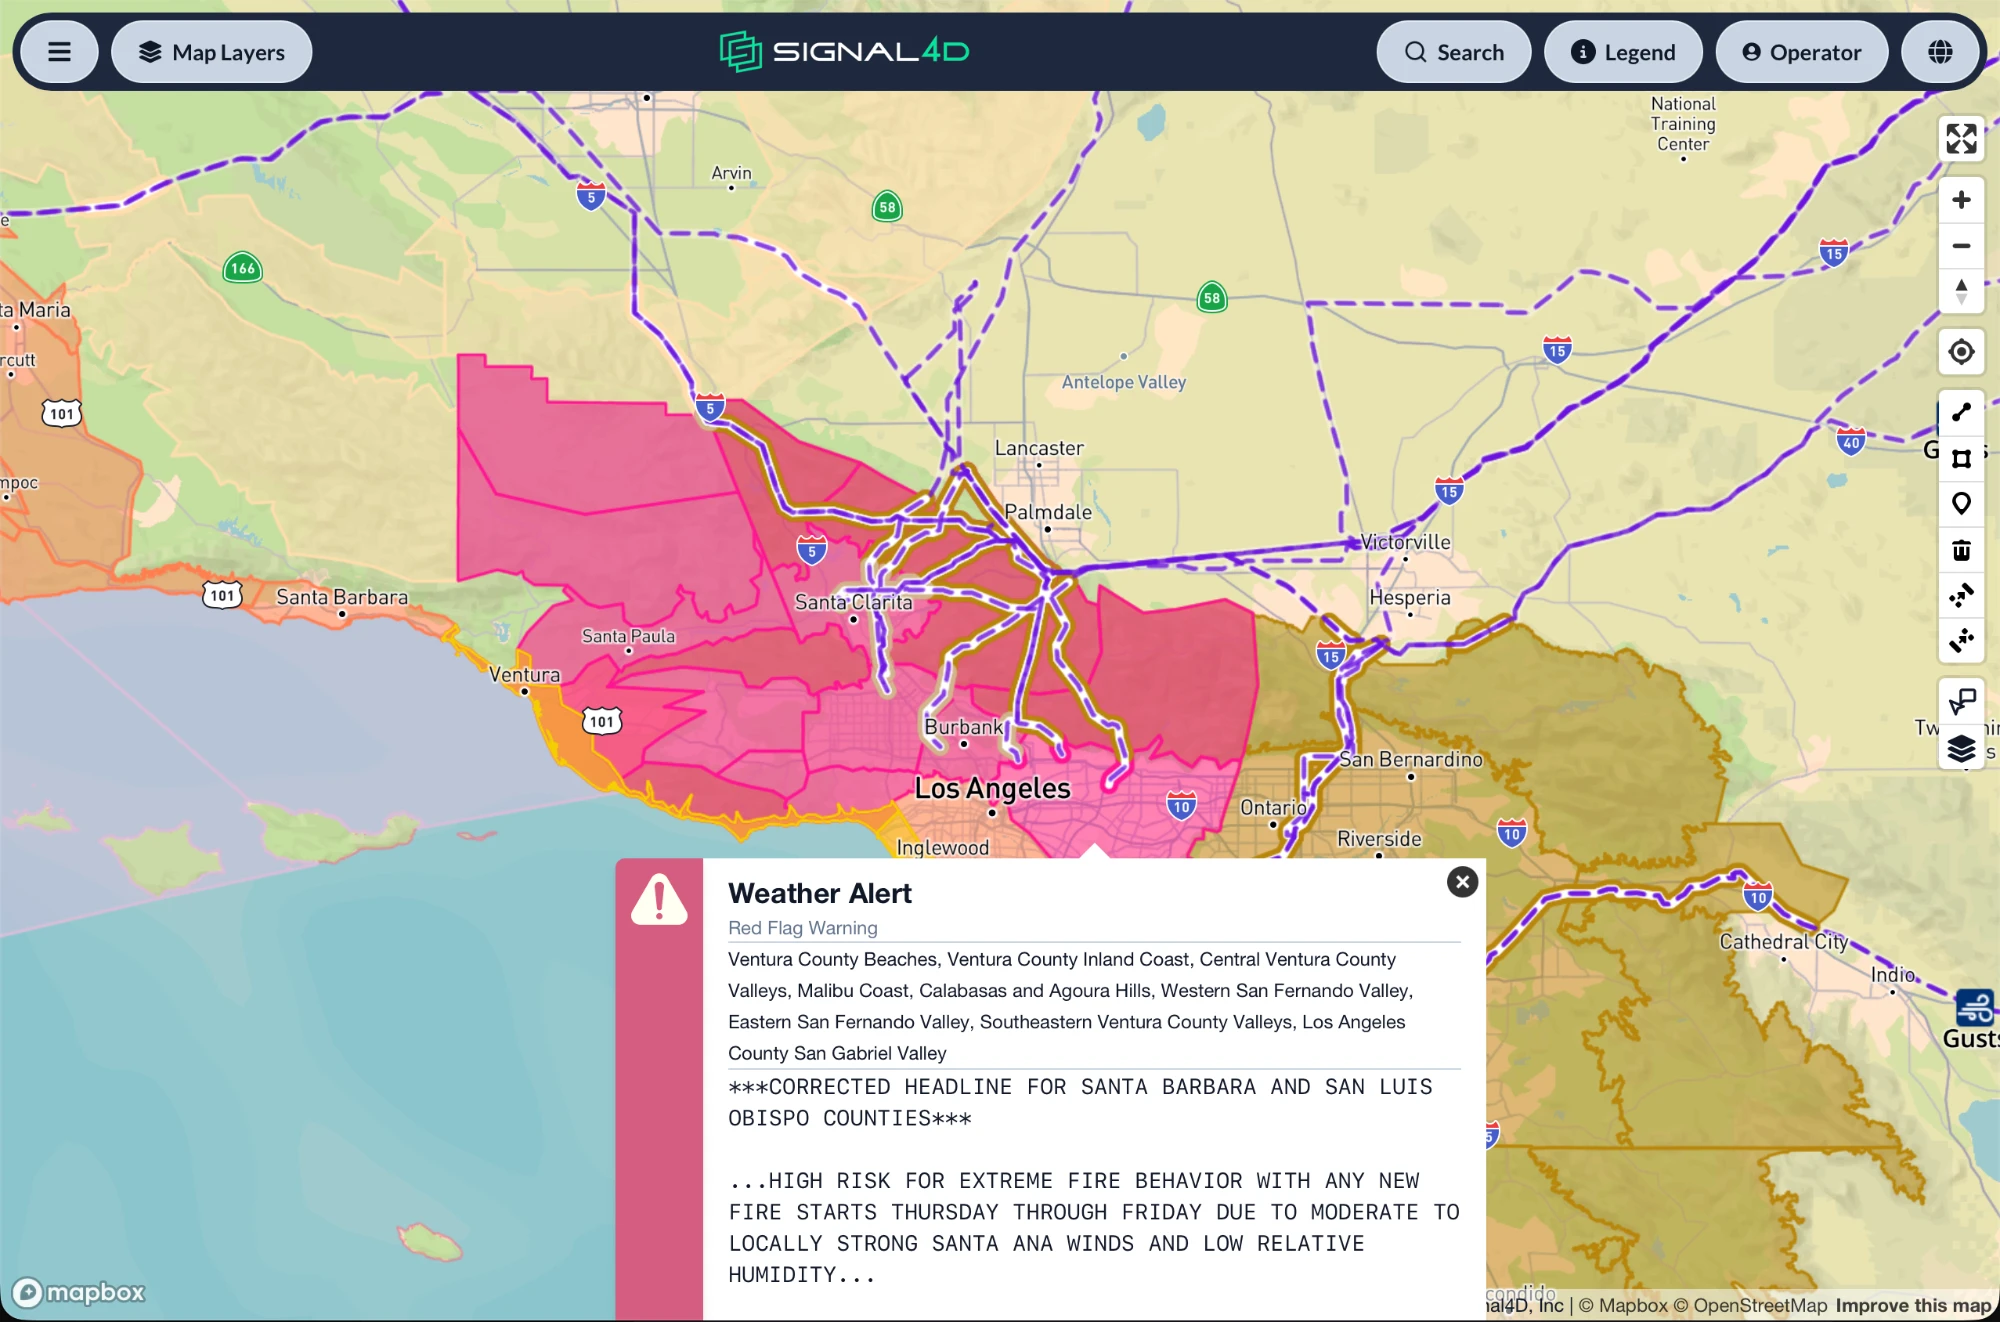
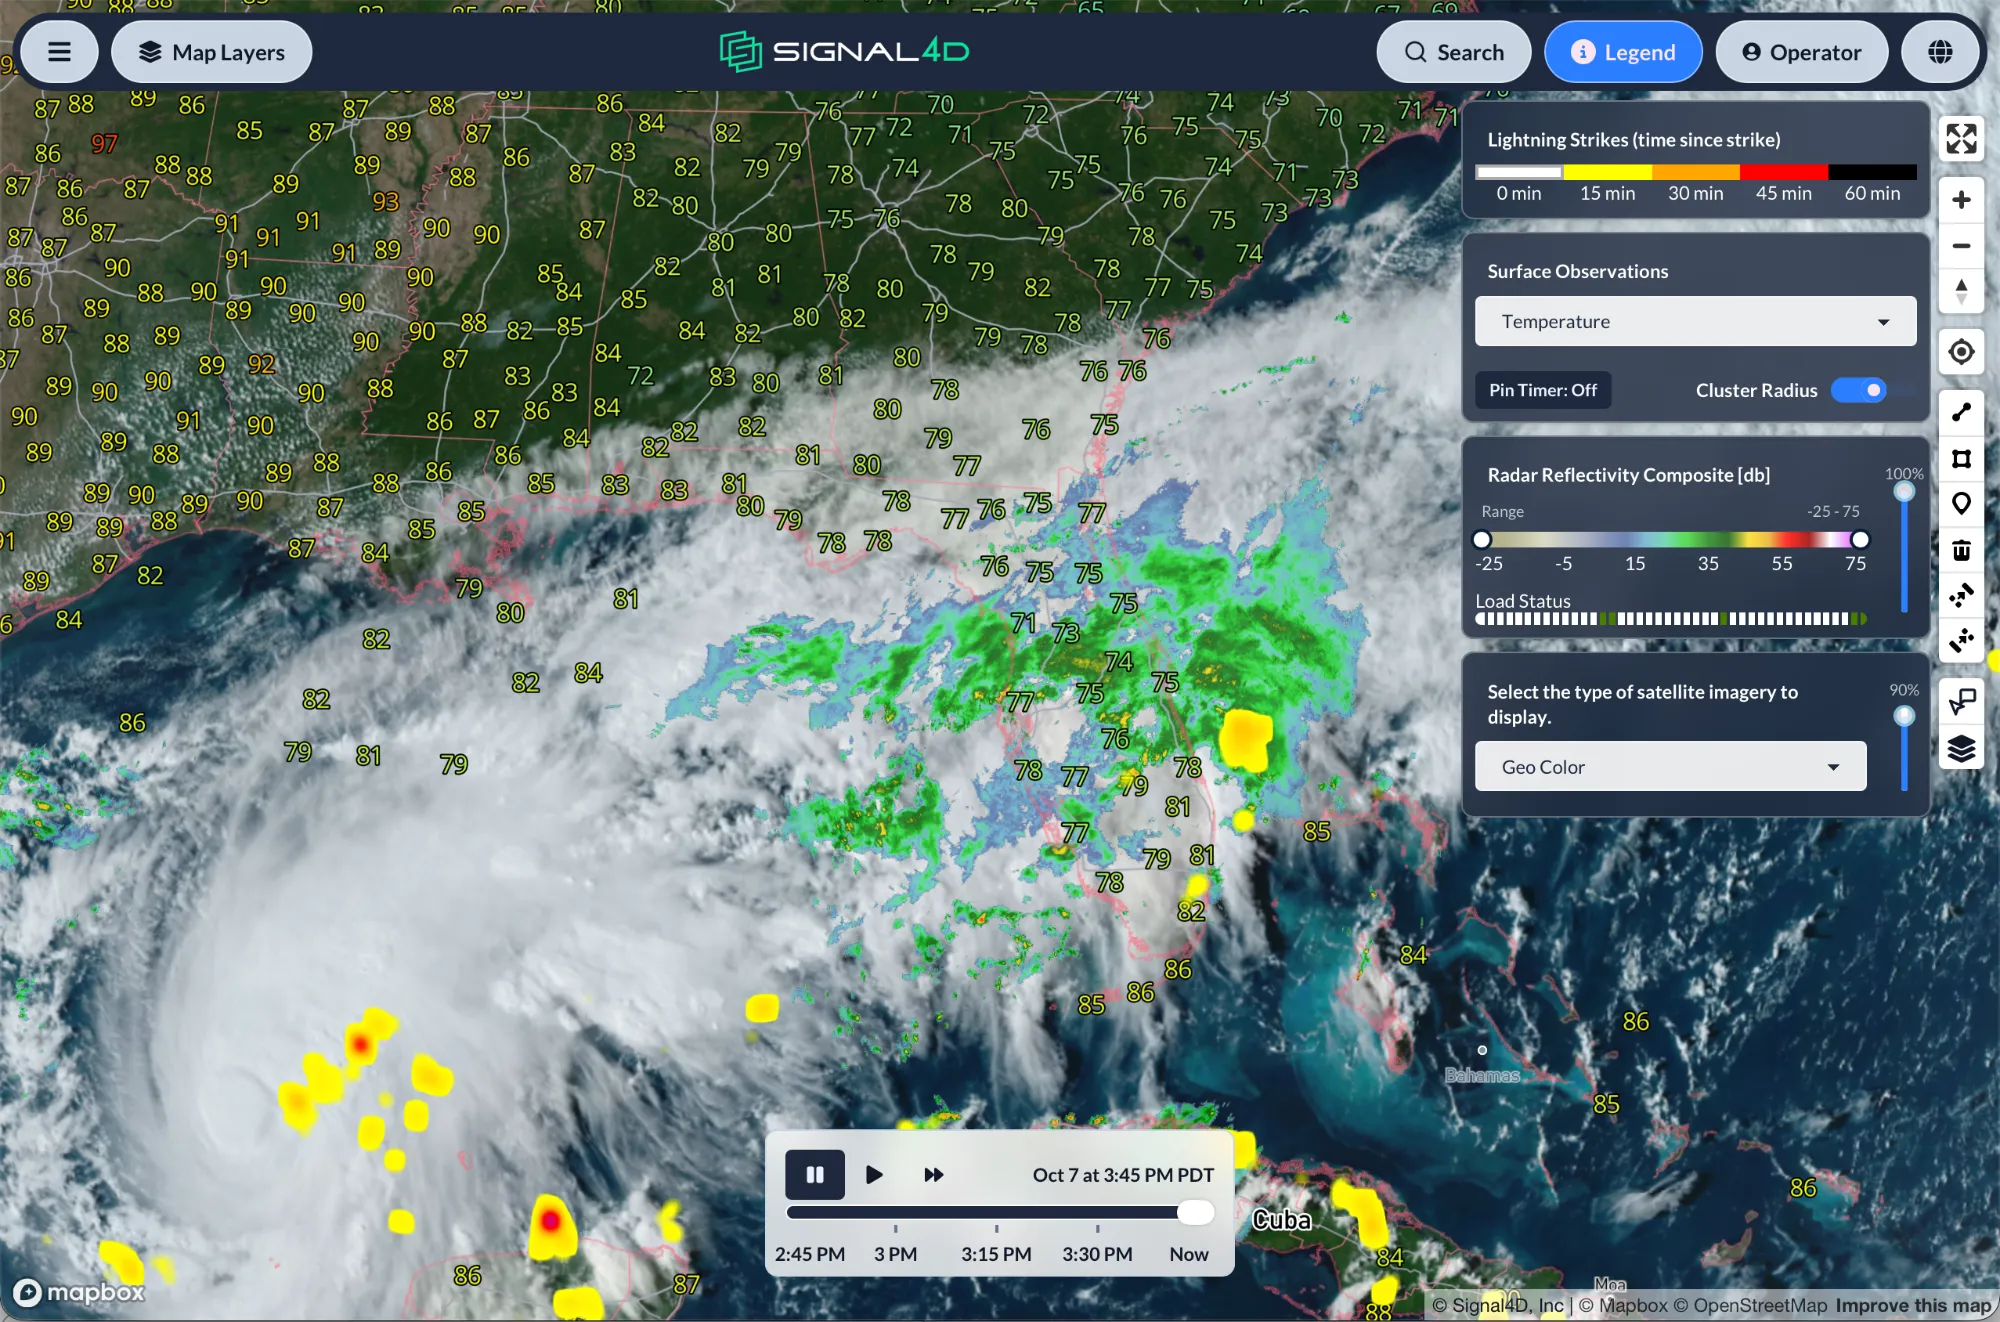
- Red-flag fire-weather conditions
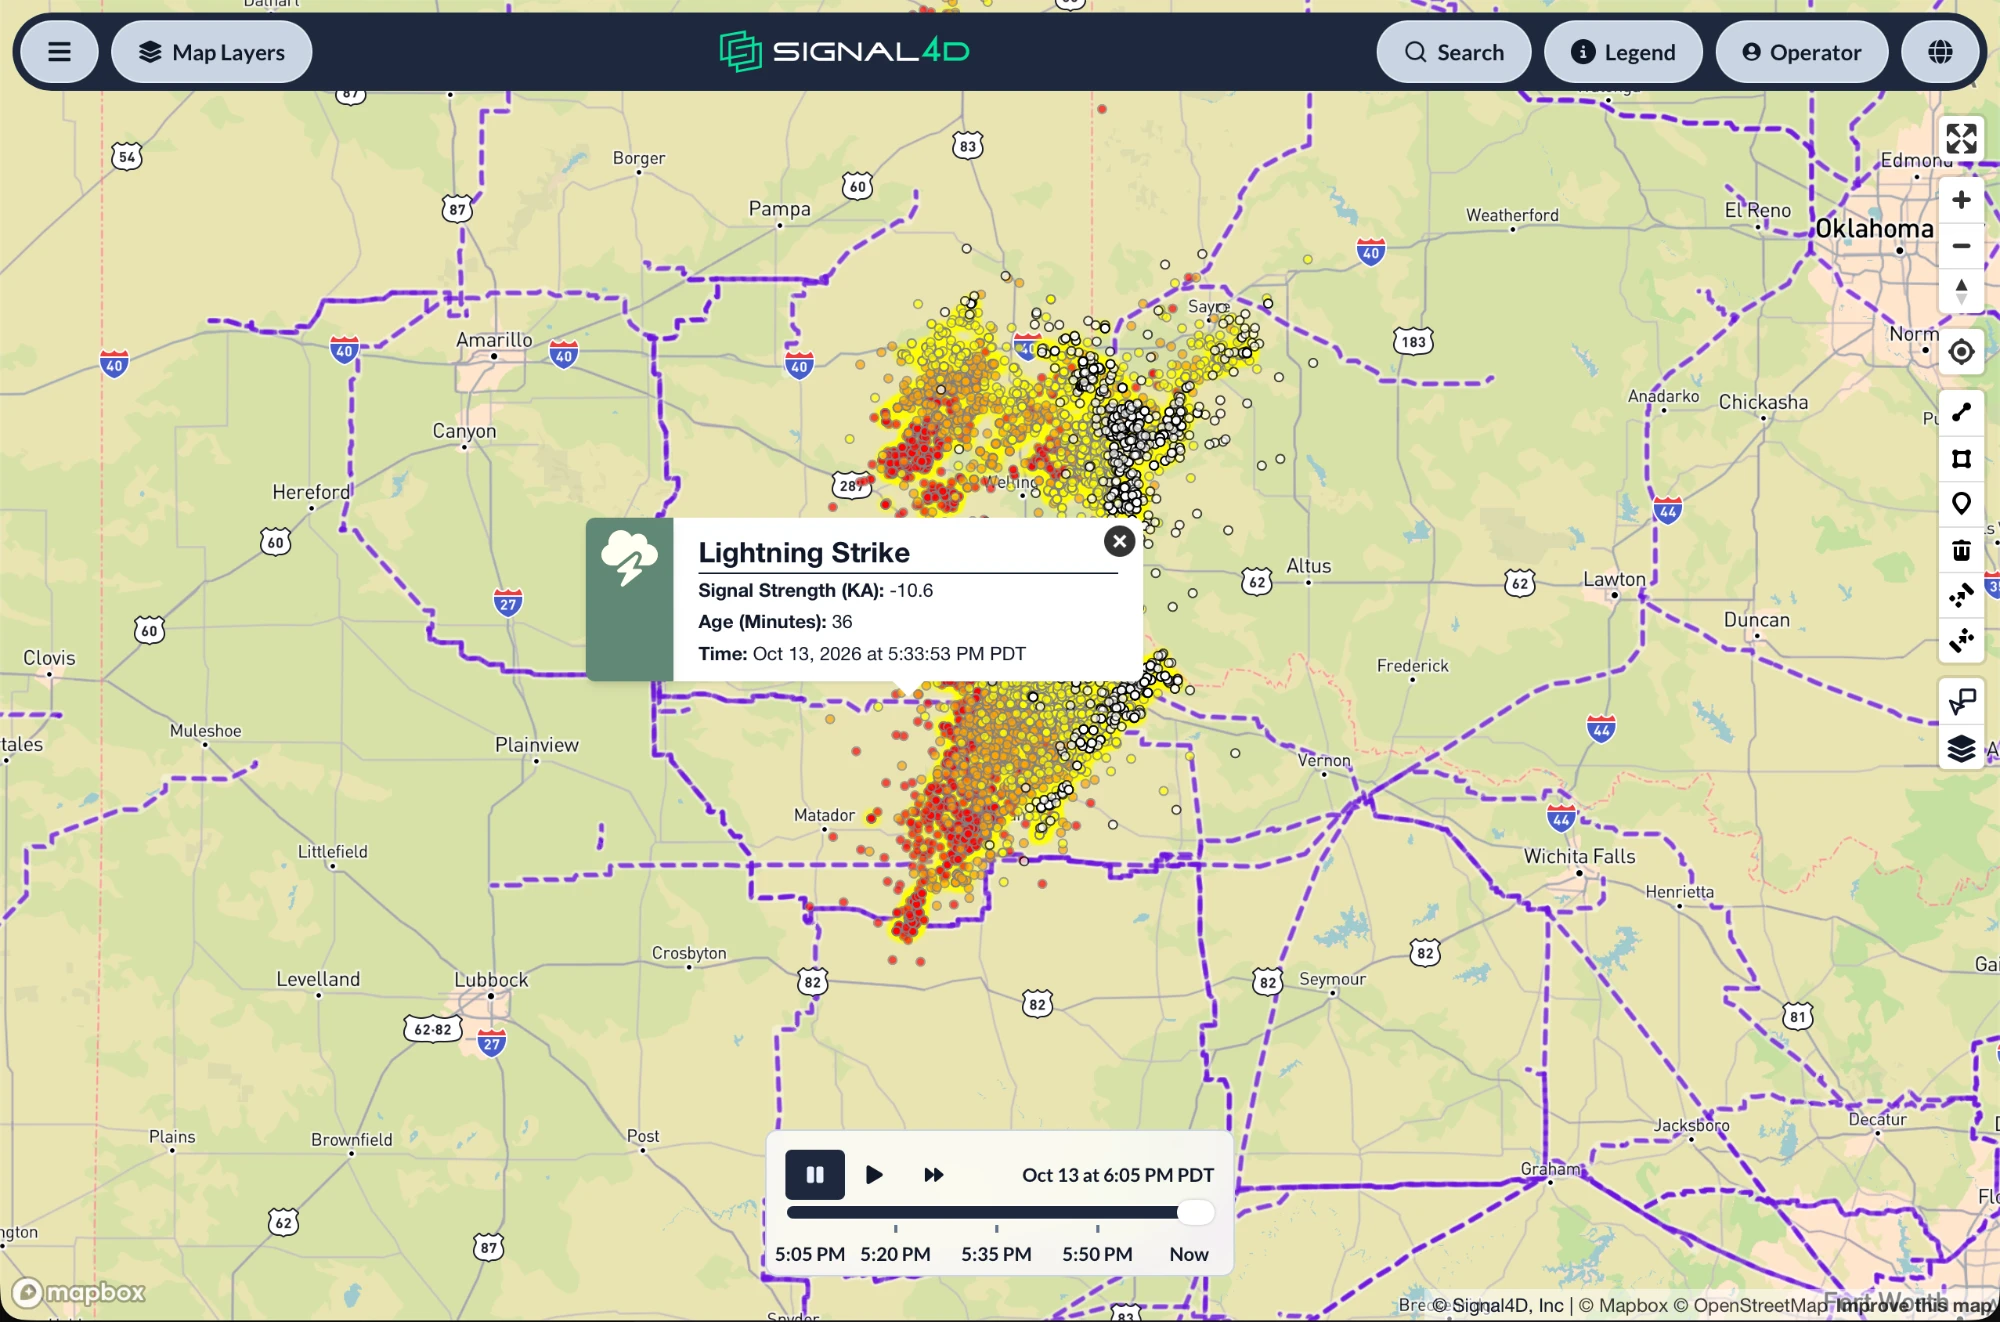
- Lightning strikes, in real time
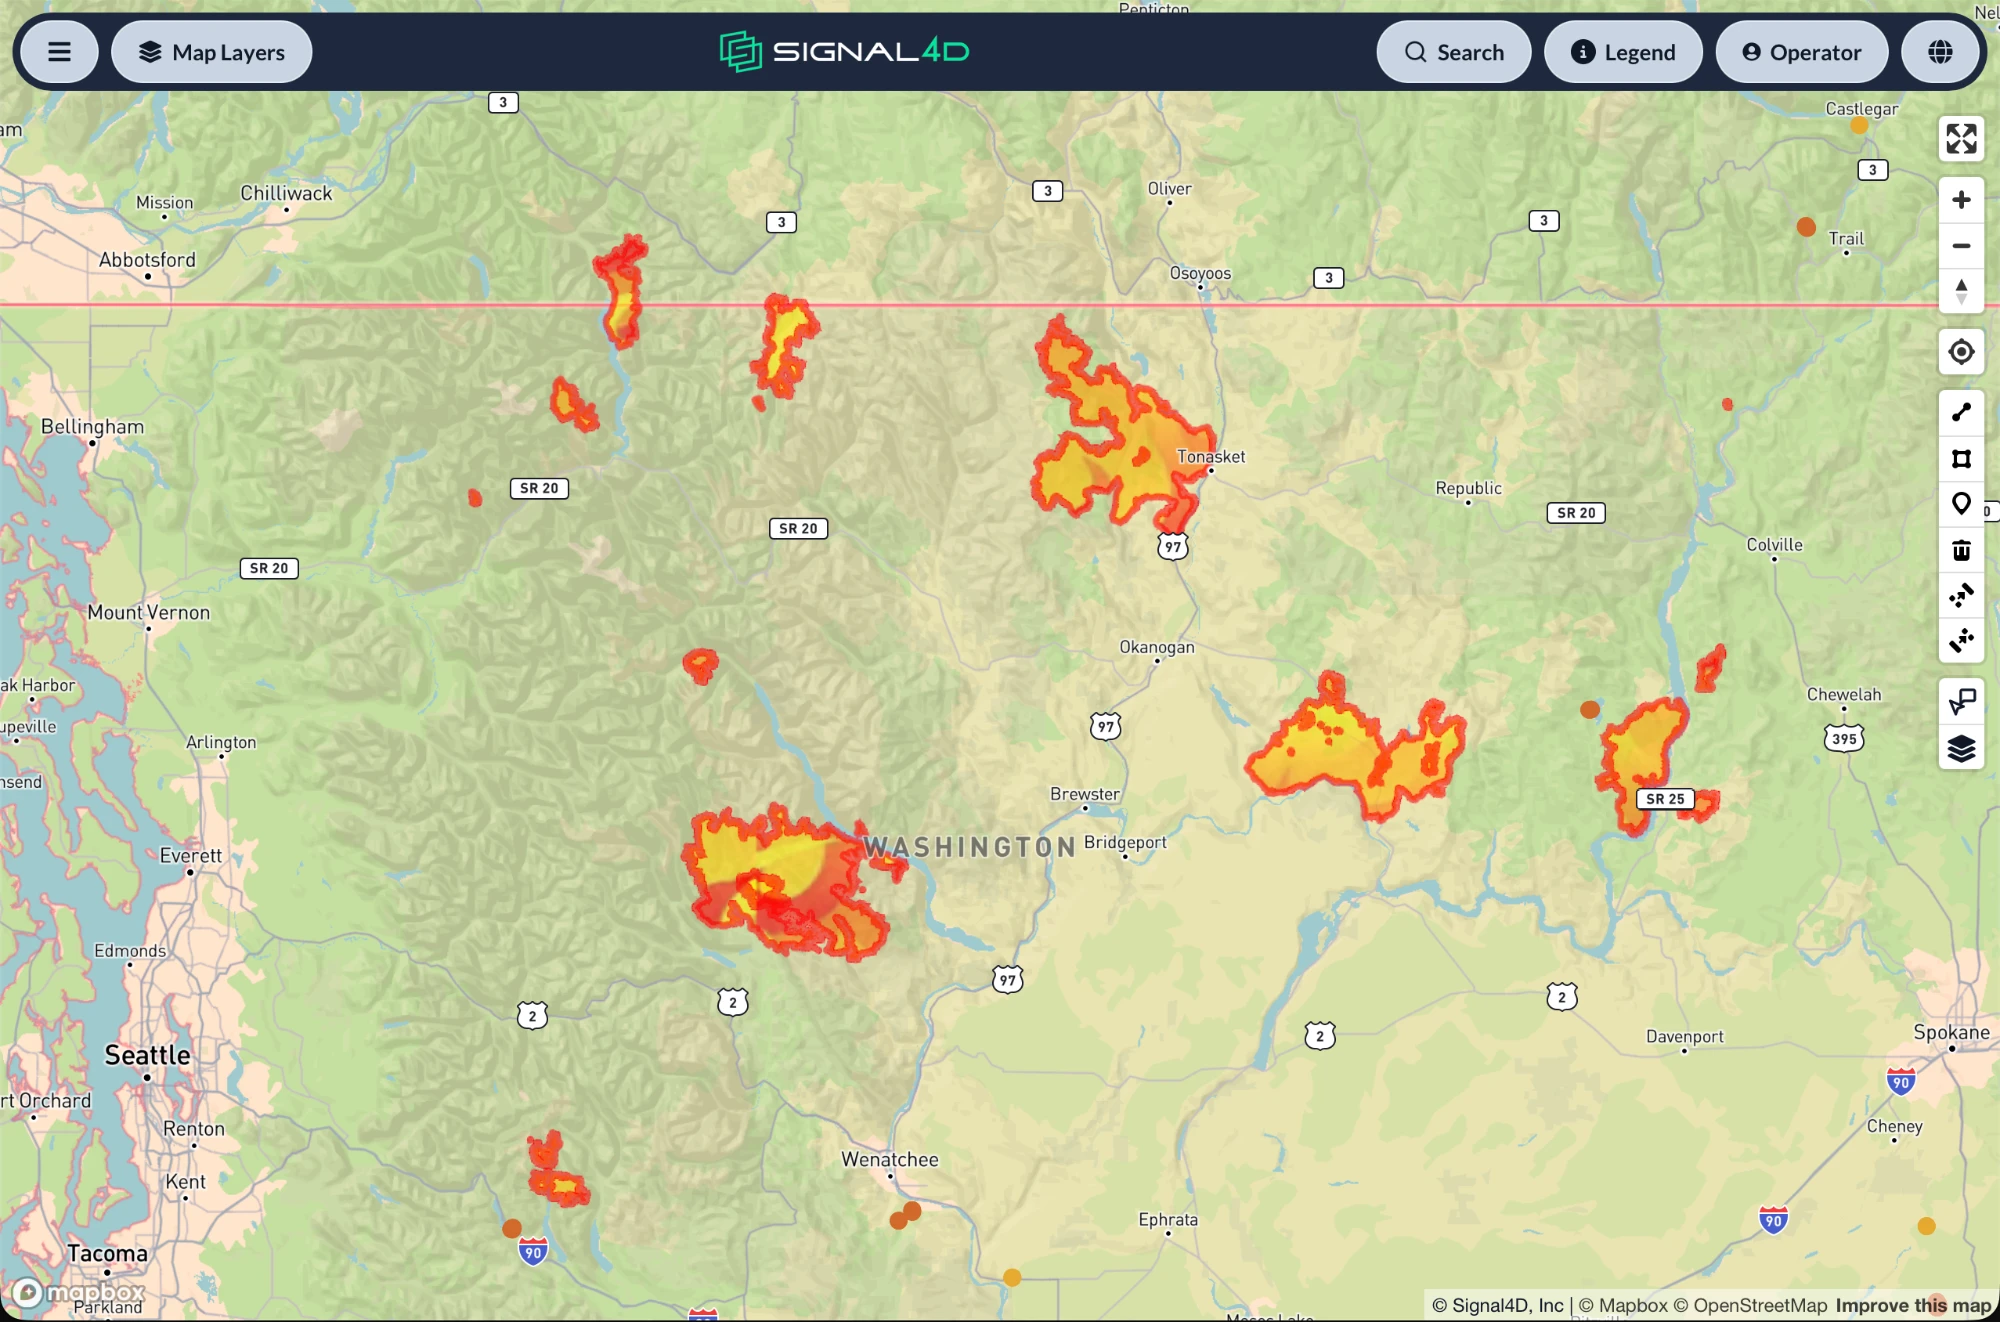
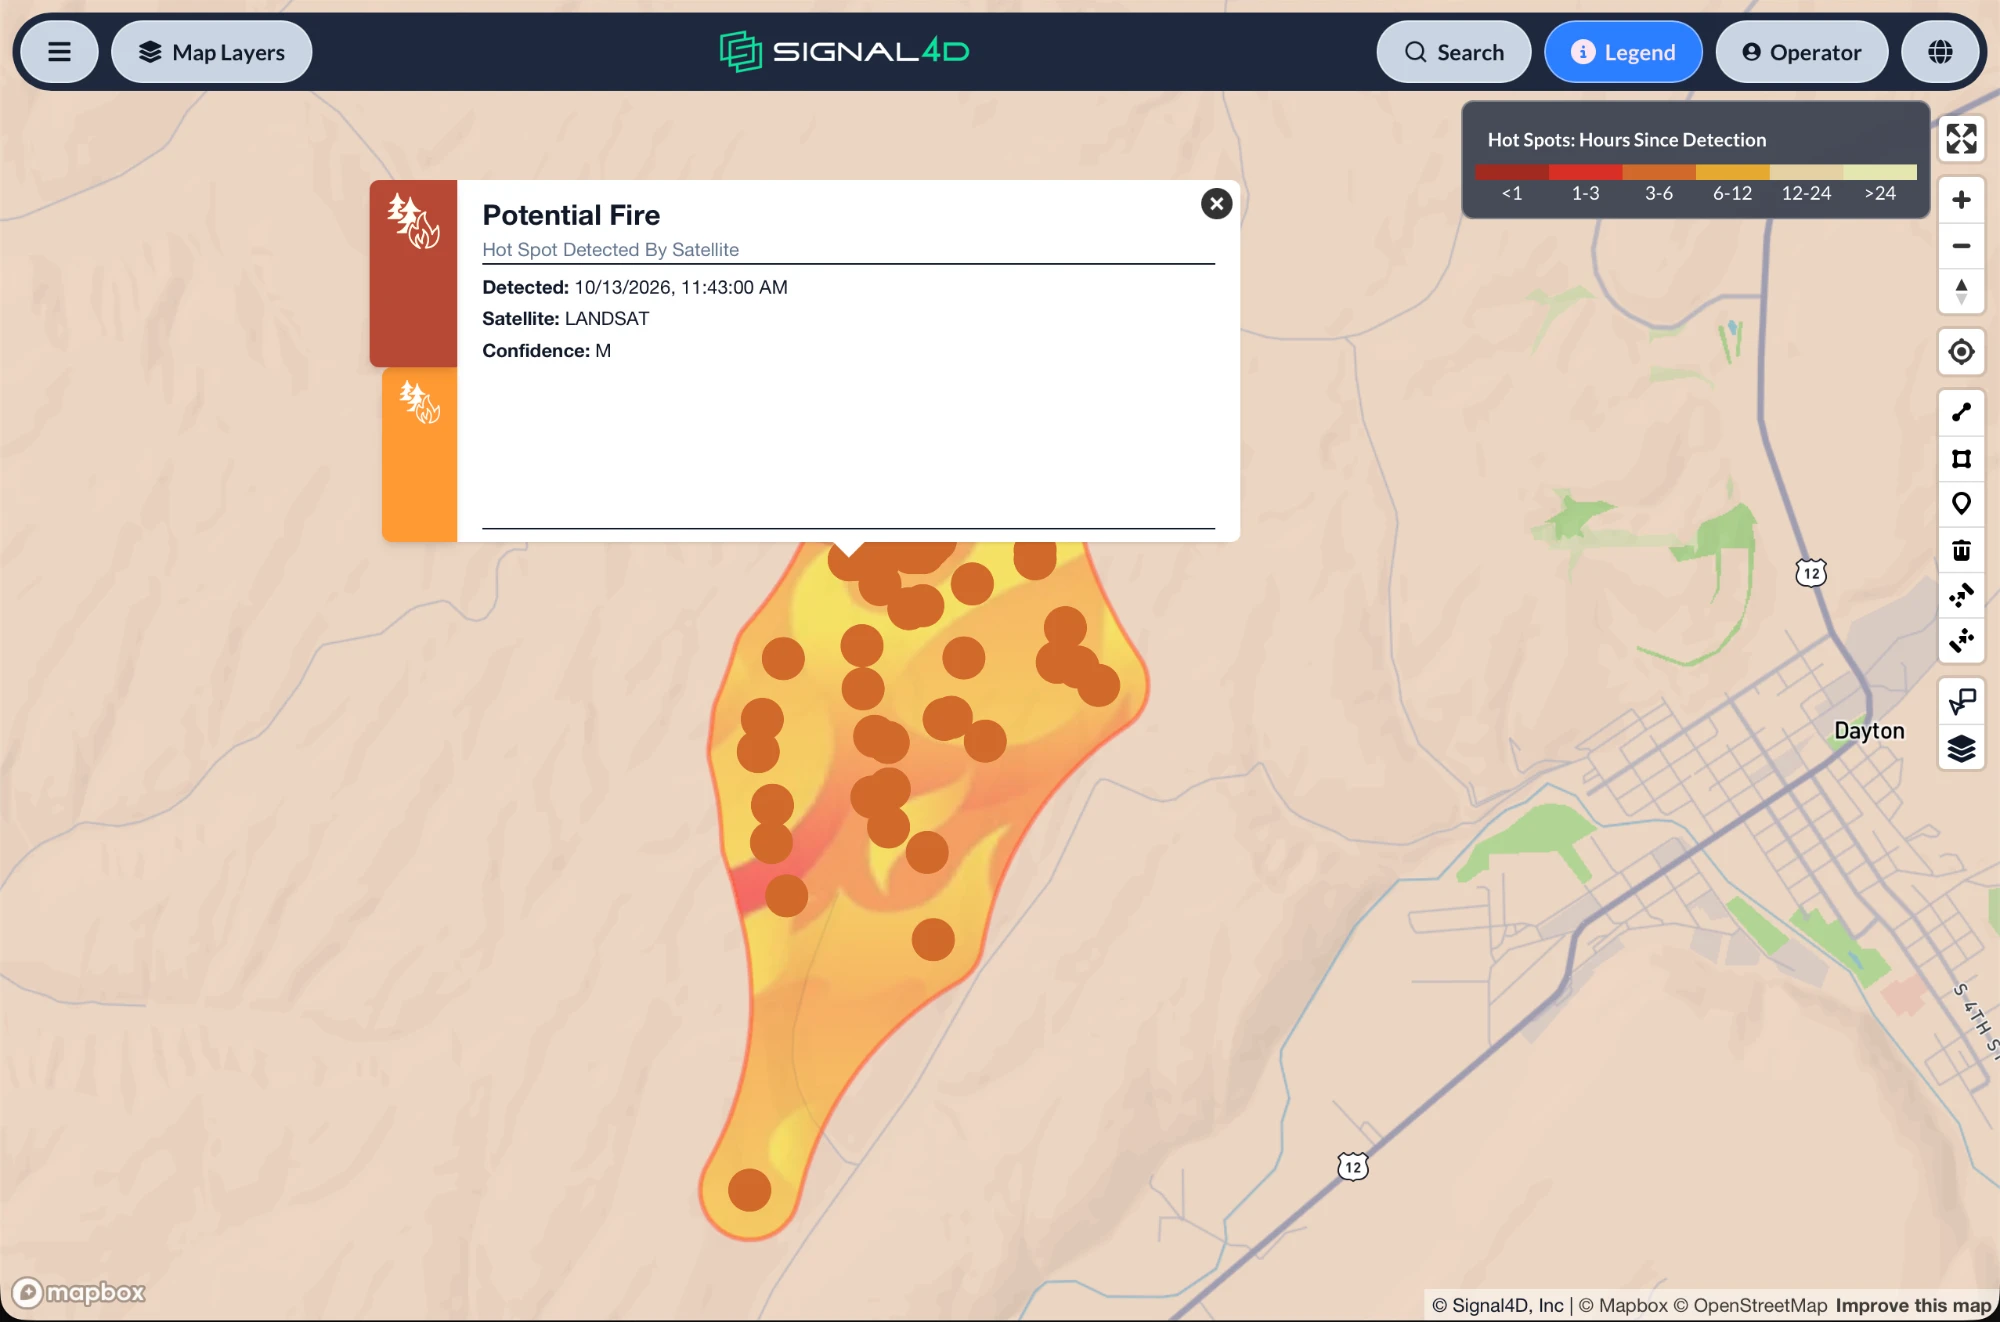
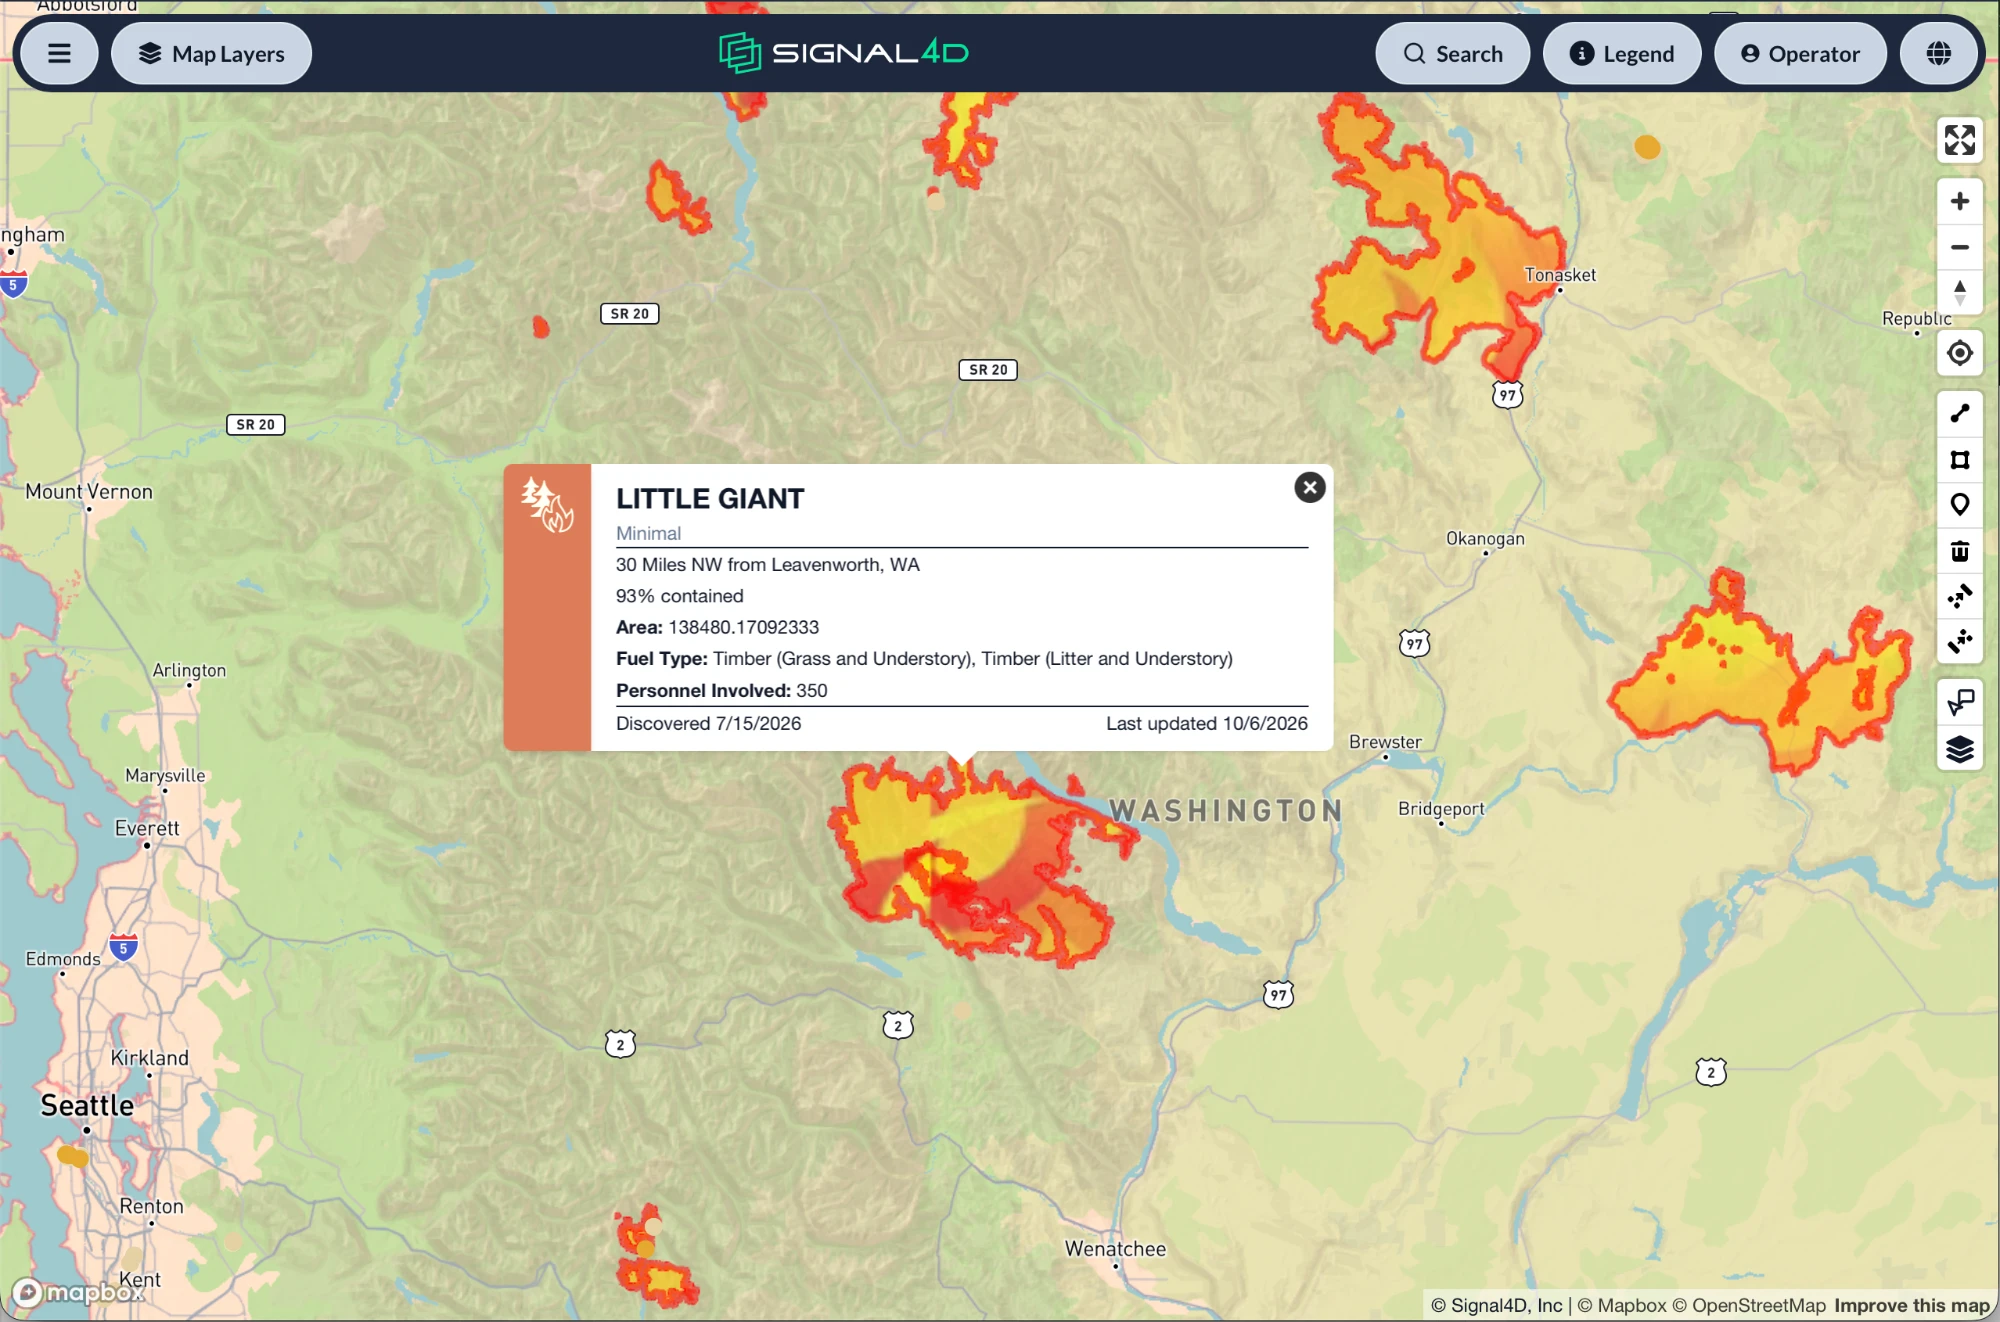
- Satellite hot spots from NOAA & NASA
- Compound events — red-flag + lightning + hot-spot
It pinpoints precise impact
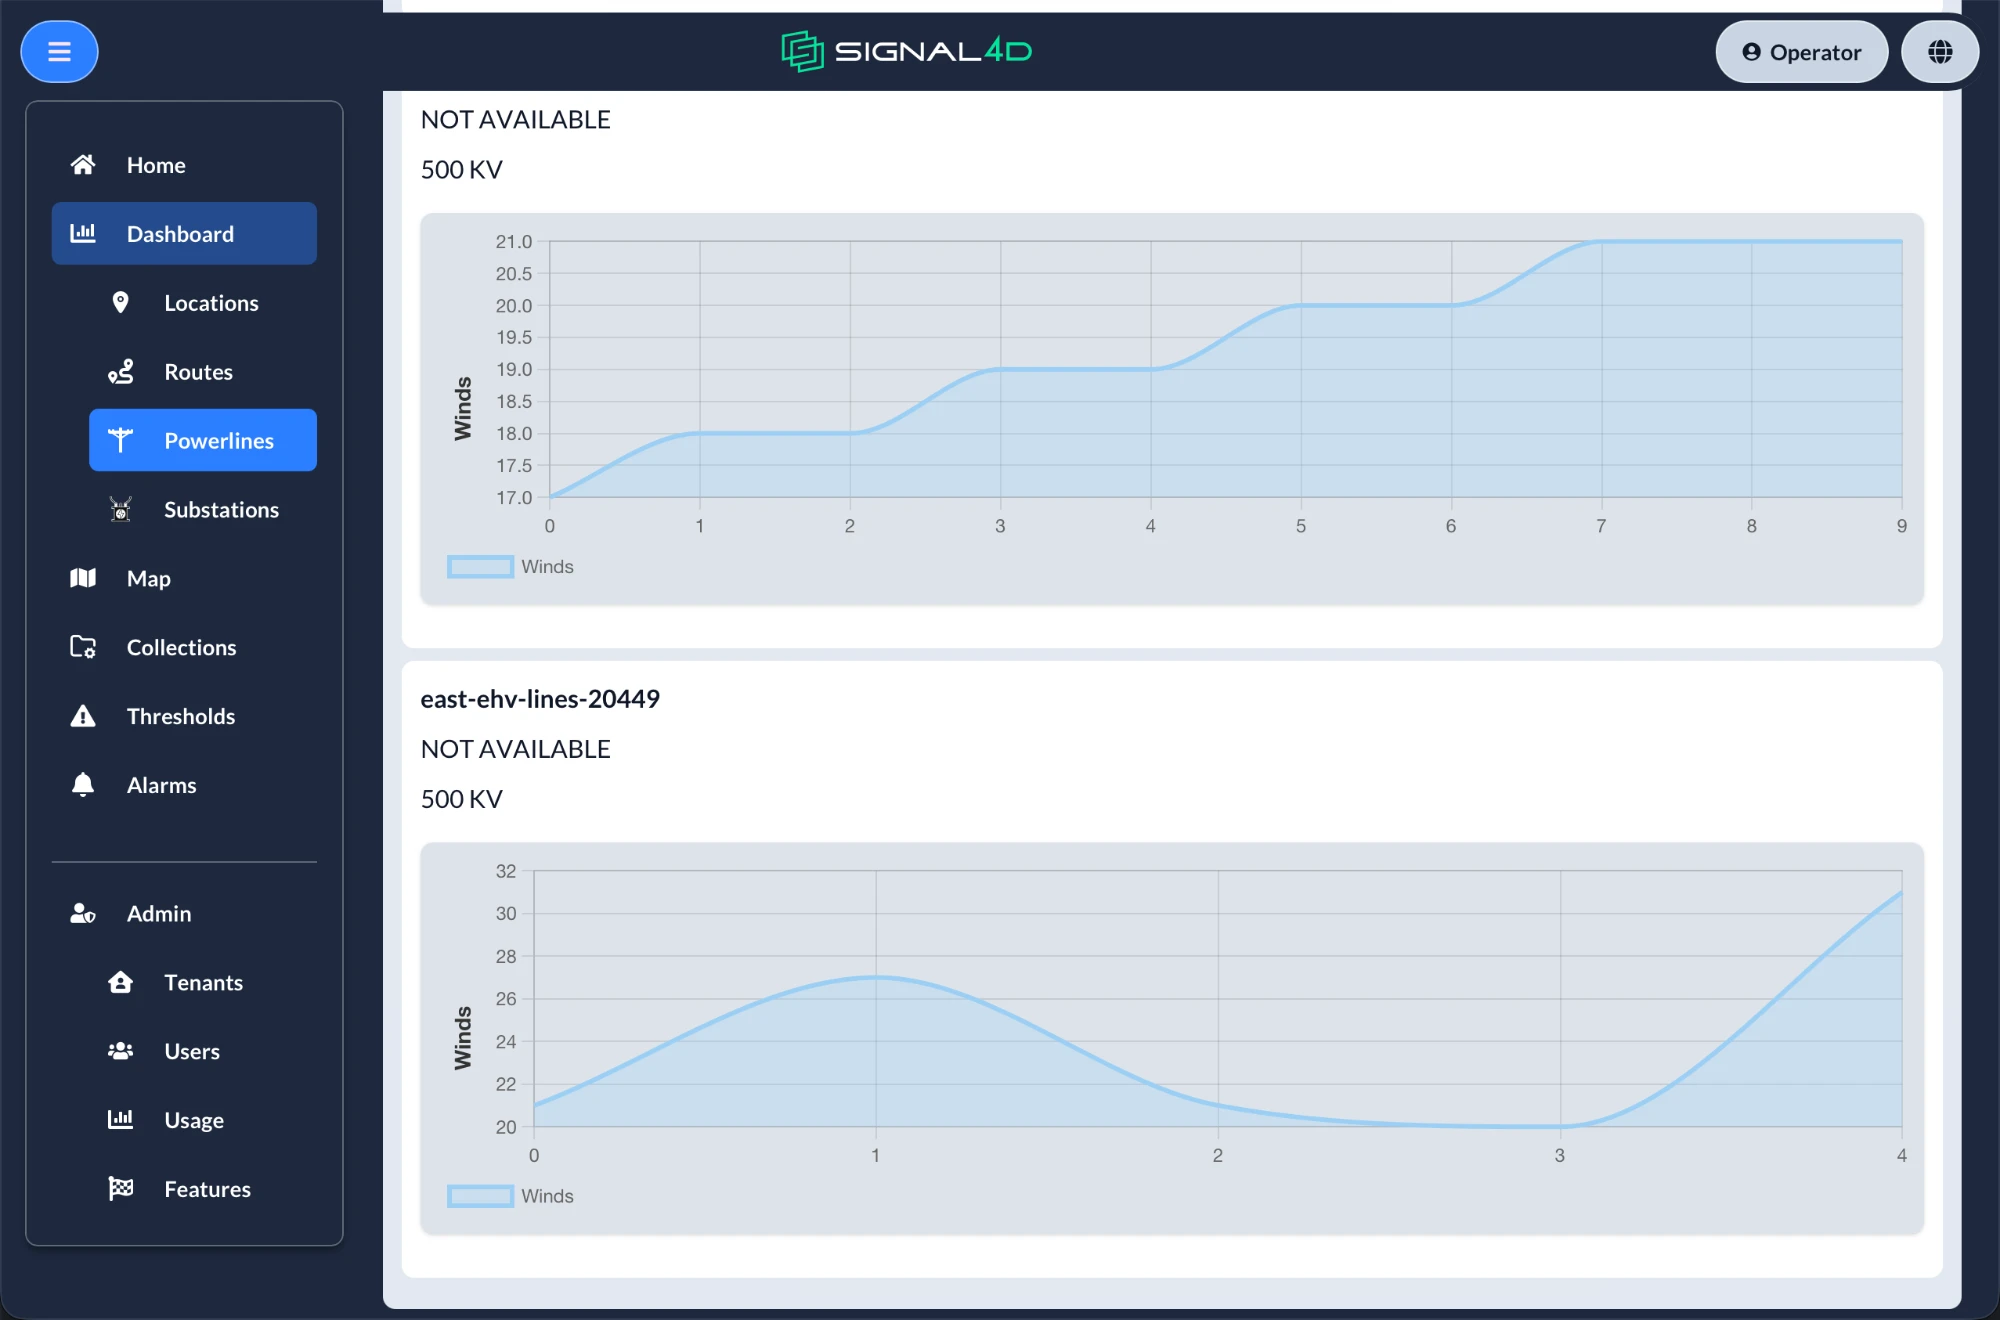
- The specific section of power line at risk
- The moving assets affected
- Specific locations, with timing
Example compound alert: a red-flag warning and a lightning strike, followed by satellite hot-spot detection — on a specific power-line segment.
From red-flag warnings to active fires — on one screen.
What proactive resilience looks like.
Identify vulnerable grid segments before events
Prioritize inspections and pre-position crews
Reduce outage duration and speed restoration
Real-time location awareness of personnel & assets
A coordination hub across large service territories
Protect timber, land, facilities and crews
Get ahead of fire season.
See Signal4D on your own territory, assets and data sources.